Corporate Environmental Management
Sections
As insurers with a long-term focus, companies are aware of the current environmental challenges arising from their business activities (GRI 103-1). That is why Swiss insurance companies engage where they can bring about specific and positive changes.
Most insurance companies in Switzerland base their ecological balance sheet on the recognised standard of the association for environmental management and sustainability in financial institutions (www.vfu.de) (GRI 103-2). This involves quantification and reporting of energy, water and paper consumption and CO2 emissions. To allow comparisons to be drawn between the different companies, the data is presented on the basis of full-time equivalents (FTEs). Only the direct emission of greenhouse gases is measured. The grey energy associated with products is not included, as no systematic collection process is in place for this data.
Greenhouse gas balance sheet
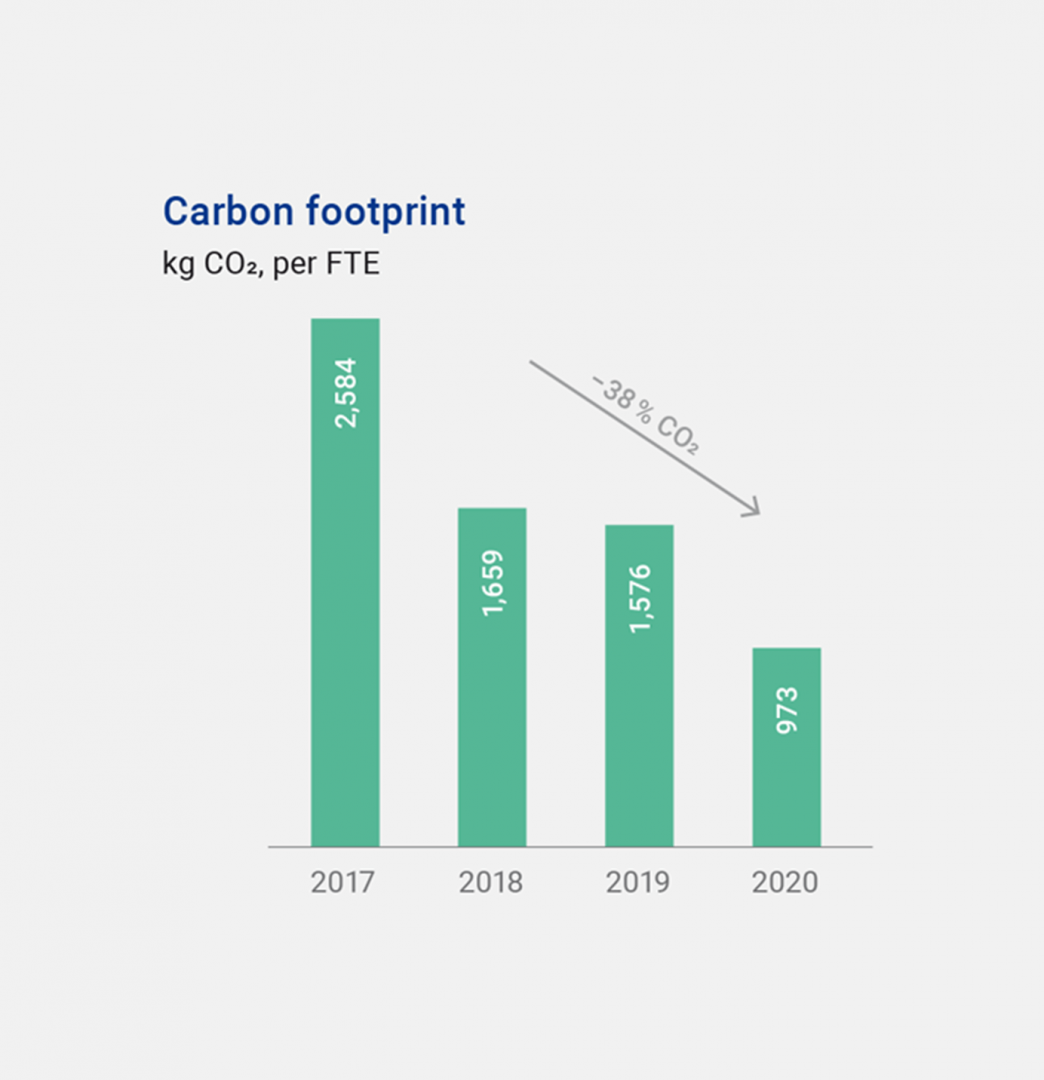
An evaluation of the figures reported for 2020 indicates a general improvement in the ecological balance sheet. For example, the carbon footprint per FTE was reduced from 1,553 kg in the previous year to 973 kg in 2020. This corresponds to an improvement of 62 per cent within a year.

An evaluation of the figures reported for 2020 indicates a general improvement in the ecological balance sheet.
(GRI 302-3, GRI 302-4, GRI 305-4, GRI 305-5)
| Unit | 2017 | 2018 | 2019 | 2020 | Relative change | |
|---|---|---|---|---|---|---|
| Building energy consumption | in kWH | 4156 | 4208 | 3958 | 3526 | 11 % |
| Heating energy consumption | in kWH | 1886 | 1469 | 1477 | 1295 | 12 % |
| Electricity | in kWH | 3408 | 2637 | 2468 | 2039 | 17 % |
| thereof share of renewable electricity | in % | 82 | 54 | 55 | 57 | 3 % |
| Water consumption | in m3 | 13 | 12 | 12 | 8 | 34 % |
| Paper consumption | in kg | 79 | 59 | 51 | 45 | 12 % |
| Volume of waste | in kg | 120 | 108 | 109 | 85 | 22 % |
| Business travel | in km | 7263 | 6010 | 5298 | 2309 | 56 % |
| of which km by air | in % | 35 | 16 | 14 | 4 | 69 % |
| of which km by car | in % | 43 | 63 | 59 | 69 | 17 % |
|
of which km by public transport |
in % | 24 | 20 | 67 | 24 | 64 % |
| CO2 emissions | in kg | 2584 | 1659 | 1576 | 973 | 38 % |
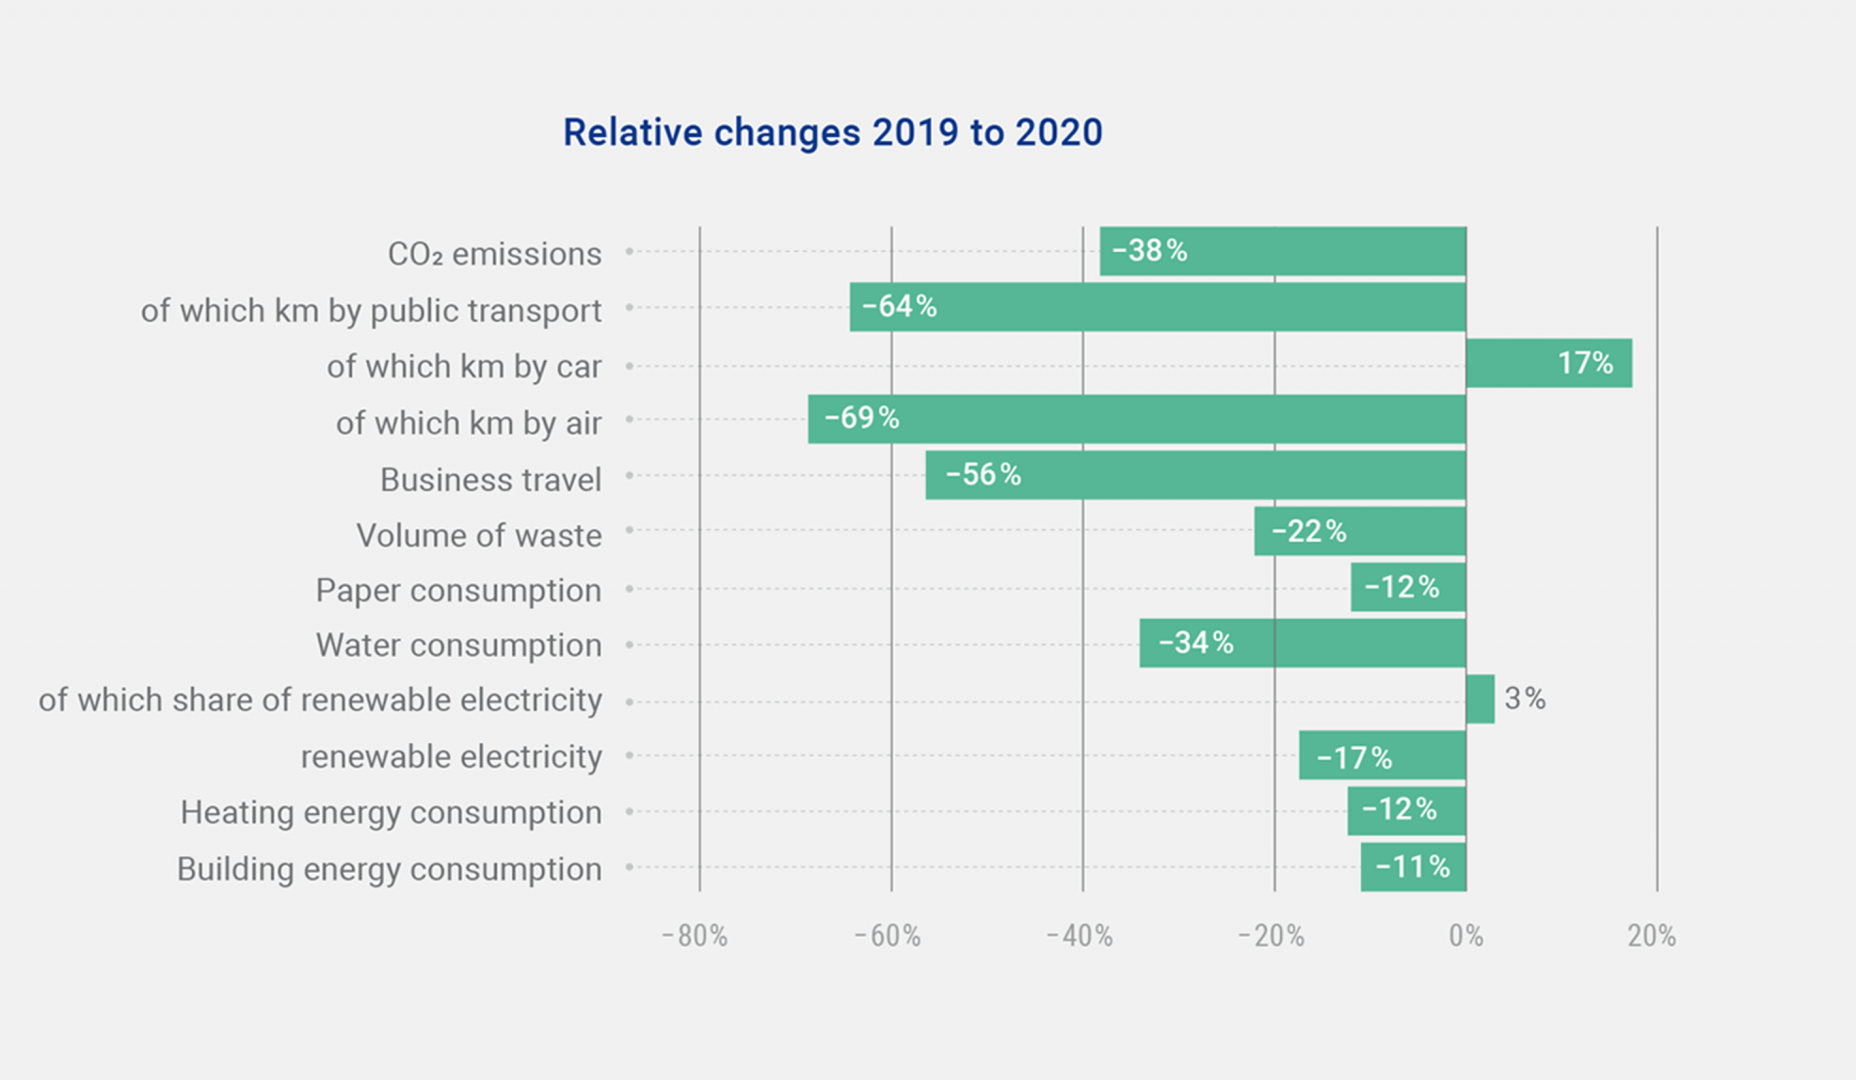
COVID-19 dominated 2020 (GRI 103-3). Certain values reflect just how much the pandemic affected various business practices and thus consumption. The replacement of business travel, as the largest energy driver to date, by building energy consumption is a particularly striking example.
Down by 56 per cent year-on-year, business travel shows the biggest relative change. This is due primarily to the increased shift to working from home and on-site working and meetings replaced with online services, thus rendering daily commutes obsolete. The 17 per cent increase in car use can be explained by the fact that many employees avoided public transport during the pandemic.
Building energy consumption was the largest driver of energy consumption in 2020, although this figure was reduced significantly by 11 per cent compared with the previous year. Other values also all show a reduction in consumption. Measures were also taken to help increase the share of renewable electricity.

Building energy consumption was the largest driver of energy consumption in 2020, although this figure was reduced significantly by 11 per cent compared with the previous year. Other values also all show a reduction in consumption.
Operational ecology
Reducing greenhouse gas emissions to net zero is a priority for many companies. The complete conversion to electricity generated from renewable and low-carbon sources makes an important contribution to this. This measure is already actively promoted by numerous companies at their individual locations. Other measures include the use of more energy-efficient fleet vehicles and investment in climate protection and compensation projects.
Companies were increasingly focusing on sustainability in business travel even before COVID-19. For example, some companies provide employees with energy-efficient fleet vehicles and charging stations for private vehicles or compensate them financially for the use of public transport or bicycles. Although flexible working models, such as working from home, were already in place before COVID-19, their acceptance and appeal rose to new levels during the crisis. In 2020, many companies recognised the positive impact of flexible working models on the environment. In order to further reduce emissions, they want to continue to promote this trend in the future.
Numerous companies are reducing paper and PET consumption by raising awareness among employees and switching to more environmentally-friendly consumer products (e.g. recycled paper, coffee mugs instead of disposable cups).
Entrepreneurial concepts to promote sustainability require the involvement of the workforce as a whole. Transparency, information and motivation alone will result in employees acting sustainably in the long term. Thus, sustainability objectives and the associated measures are communicated transparently, with targeted action taken to promote intrinsic motivation (e.g. compensation for public transport and bicycles).
Sustainability Report 2020
-
Foreword
Read more
-
Management summary
Read more
-
Committed to sustainability
Read more
-
Insurers assume social risks
Read more
-
Method and definition
Read more
-
Investment
Read more
-
PACTA 2020: the lessons learned from the climate compatibility test
Read more
-
Retirement provision
Read more
-
The working world
Read more
-
Corporate Environmental Management
Read more
-
Impact of climate change
Read more
-
Collaboration for sustainable development
Read more
-
Appendix
Read more